Home • Products • GNSS Testing & Simulation • Panorama

Panorama Visual Analysis Tool for GNSS Receiver Data

About
Panorama is the flagship tool when it comes to analyzing receiver data. When engineers use Panorama they spend more time looking at plots and making decisions, instead of making plots and writing reports. Panorama takes receiver data (.csv files) from PANACEA and RxStudio (other ODS products) and turns it into over 60 engineering plots ready to view at the click of your mouse. These plots give engineers and analysts the ability to view summary level data, head to head comparisons, receiver specific results, and 3D LLA replays using STK.
PANACEA and Panorama provide a cohesive data collection and reporting capability that enables testers to show the data in real-time providing after action reporting near instantly.
Data Sources
Panorama is a tool that is used to view and analyze GNSS receiver output data. Panorama was designed specifically to take the log files that PANACEA and RxStudio generate and turn them into engineering plots.
-
Panorama allows users to place receiver data anywhere on their machine.
-
Easily input multiple data sources from various locations on your machine.
-
Panorama will automatically populate using the default file directories.


Automatically Generate Reports
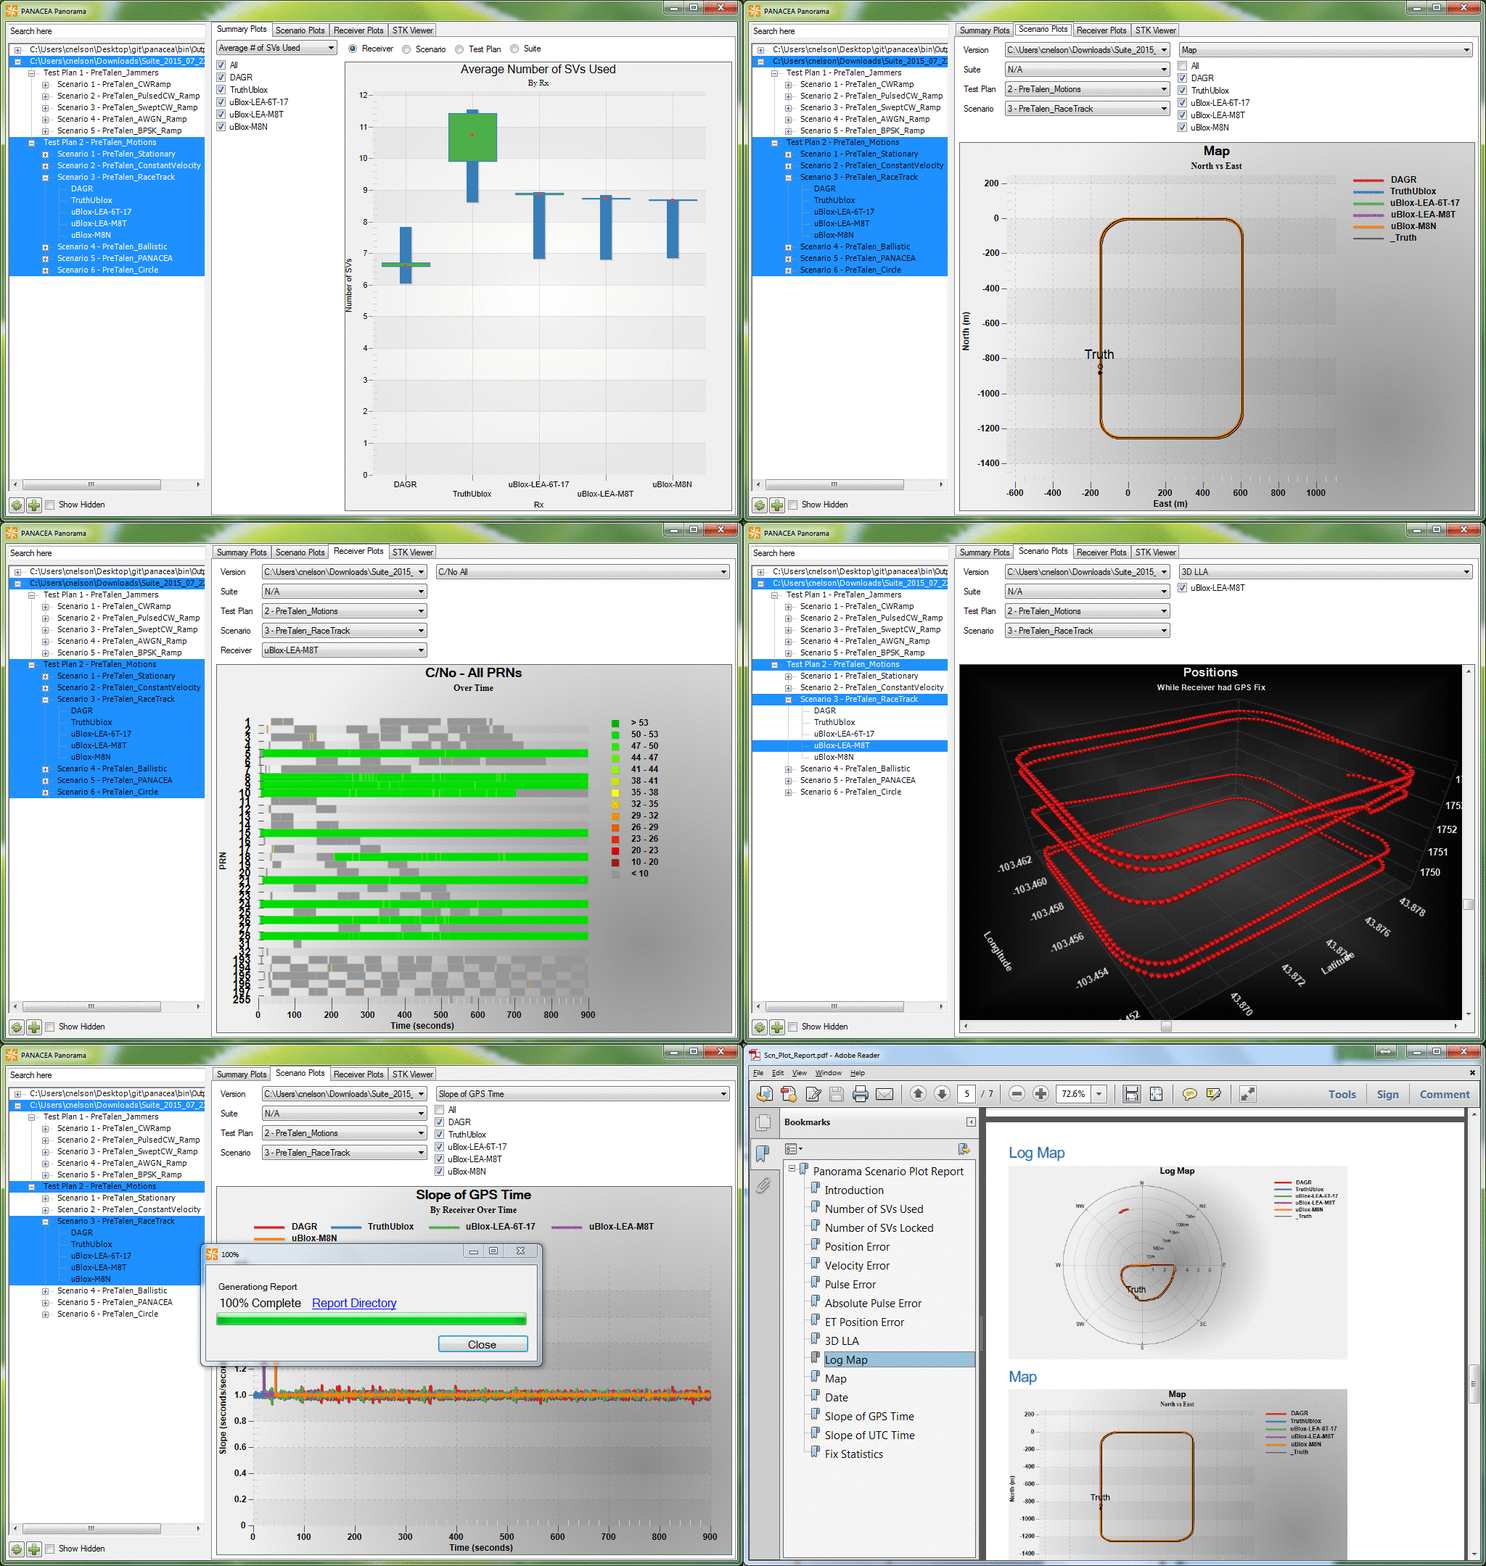
Panorama supports automatic report generation for scenarios and specific receivers. With 1 click of the mouse, you can generate hundreds of reports that provide detailed descriptions of the scenario and corresponding plots.
When you click to automatically generate scenario reports, two reports for each scenario will be generated: Scenario Description Report and Scenario Plot Report.
Scenario Description Report
Scenario Description Report
The scenario description report provides the actual data entries for paramaters such as: Scenario name, notes, duration, truth source, timelines, motion profile, LLA, GPS constellation, constellation (almanac, ephemeris, time, code), jamming, events and more. This report can be used as an example to show others how to create this exact scenario and how to configure and test the UUT’s in the same configuration.
Scenario Plot Report
The scenario plot report provides the plots (not numbers) within the PDF for the following: # SVs used, # SVs locked, position error, velocity error, pulse error, absolute pulse error, ET position error, 3D LLA, log map, slope of date/time, and fix statistics. These plot reports are excellent for decision making and for analyzing how the receiver performed in different scenarios.
PLOT INFO
Summary Plots
The summary plots tab allows users to view parameters such as average number of SVs used, average position error, time to first fix and many more at a test plan level (where scenario data is aggregated together). While viewing the summary plots tab, users can easily flip views to look at specific receivers, scenarios, test plans or even suites.
✔ Average # of SVs Used ✔ Average # of SVs Locked ✔ Average Position Error ✔ Average Velocity Error ✔ Average Pulse Error ✔ Average Date ✔ Percent Frames Received ✔ Percent under Threshold ✔ Percent of Time Fixed ✔ Percent of Frames Fixed ✔ Time of First Fix ✔ Time of First Loss ✔ Time of Last Fix
Scenario Plots
The scenario plots tab goes one step deeper to view receivers under test for a specific scenario. Scenario plots provide side by side comparisons for all of the units under test both in performance and vulnerabilities. Data outputs include fix statistics, 3D LLA, frame time error and much more.
✔ Number of SVs Used ✔ Number of SVs Locked ✔ Position Error ✔ Velocity Error ✔ Pulse Error ✔ Absolute Pulse Error ✔ ET Position Error ✔ 3D LLA ✔ Log Map ✔ Map ✔ Fix Statistics ✔ Date ✔ Slope of GPS Time ✔ Slope of UTC Time ✔ Frame Time Error
Receiver Plots
The receiver plots tab allows for the deepest dive where engineers can analyze one specific receiver for a specific scenario. Plots of DOP, C/No used, SV elevation and various others can be seen under the receiver plots tab.
✔ Number Used/Locked ✔ Position Error ✔ Velocity Error ✔ Position Error Estimate ✔ Pulse Error ✔ Absolute Pulse Error ✔ ET Position Error ✔ DOP ✔ C/No Used ✔ C/No All ✔ Track State Used ✔ Track State All ✔ Code Type Used ✔ Code Type All ✔ Frequency Used ✔ Frequency All ✔ Range Residuals - Line ✔ Range Residuals - Heat ✔ Sky Plot ✔ SV Elevation ✔ SV Azimuth ✔ Date ✔ UTC/GPS Time Comparison